Abstract
The technical and vocational education and training (TVET) system in Brunei Darussalam is currently undergoing major restructuring, with the establishment of the Institute of Brunei Technical Education (IBTE) and launch of the ‘White Paper’ on transformation of TVET in May 2014. One of the aims of the reform is to ensure graduates are job-ready and employable, by shifting from being a supply-driven to a demand-driven system. Two key performance indicators (KPIs) have been identified to assess the efficiency and effectiveness of the reform and the TVET system. The first KPI focused on the ‘employability rate’ of graduates, while the second KPI looked at employers’ level of satisfaction of graduates hired. This paper reports on an employment study (ES) and employers’ satisfaction survey (ESS) carried out by the Research and Statistic Division, IBTE. With response rates of 98% for ES and 30% for ESS, we found (1) for ES, employability rate of our graduates are below the targeted KPI, at 63.7%; and (2) for ESS, employers’ satisfaction level met the targeted KPI, at 96.5%. By drawing upon these outcomes, we shared the experience in developing and executing the surveys, and identified some of the challenges faced and made several recommendations.
Key words: Technical and vocational education and training (TVET), Brunei, IBTE, transformation, governance, TVET, reform, Key Indikators
1 Introduction
By 2035, Brunei Darussalam is aiming to be internationally recognized for the accomplishments of its well-educated and highly skilled people, its quality of life, and its dynamic, sustainable economy. These are the essences of Brunei’s National Vision 2035 as authorized by His Majesty the Sultan of Brunei in January 2008. One approach to realise Brunei Vision 2035 includes the transformation of technical and vocational education and training (TVET) in Brunei, with the establishment of the Institute of Brunei Technical Education (IBTE) and the launch of the ‘White Paper’, the ‘Upgrading Plan for Technical Education Brunei Darussalam 2013 – 2018’ and the “Institute of Brunei Technical Education Order 2014” in May 2014.
There are six key changes currently being implemented over the next few years for the modernization of TVET in Brunei, viz. (i) course restructuring, (ii) expansion of apprenticeship options, (iii) reviewing progression opportunities, (iv) upgrading the training environment, (v) introducing a new scheme of teaching service, and (vi) renaming of Department of Technical Education (DTE) and the seven vocational and technical institutes (VTIs) under it. Parallel to this transformation, there is also a move from output based performance measures to outcome-based measures. Outcome based measures are preferable and require a more sophisticated method of data collection. The new reform places employability of graduates and employer’s satisfaction as the two main outcome measures.
The new outcome measures also fit into two of the four Brunei’s Ministry of Education (MOE) 2012-2017 Strategic Plan checkpoints identified to achieve quality education for the nation (Ministry of Education [MOE] 2012). The four checkpoints as identified are reduction of unemployment rate by 80%, being in top 50 in PISA, improving Brunei’s rank in the Global Competitive Index (GCI), and obtaining employer satisfaction.
The move towards outcome based measures is aligned with TVET providers around the region as it is essential for vocational and technical education educators to constantly evaluate their programs to ensure that their content remains relevant, of high quality and is in tune with the demand of the job market (Peng & Zhang 1997).
1.1 IBTE’s Key Performance Indicators
The previous system put a lot of emphasis on output measures that included the number of learner enrolments and the number who complete their courses. The new outcome measures in the transformation are written into key performance indicators (KPIs). KPIs are a set of measures that enable an organization to focus on aspects of performance that are most critical for the current and future success of the organization (Parmenter 2012). KPI is not a new concept and has been utilized in variety of organizations, including educational institutions worldwide e.g. Canada (Colleges Ontario n.d.), Australia (NCVER 2014), & Singapore (MOE 2014).
The two KPIs of IBTE are as follows:
Employability rate – the proportion of graduates employed within six months after their convocation ceremony; and
Employers’ satisfaction rate – the proportion of employers (i.e. supervisors) being satisfied with the work and performance of our hired graduates.
Accordingly, while both KPIs can only be reported annually, they seem to satisfy other characteristics of effective KPIs (Parmenter 2012). For instance, the two KPIs are non-financial measures, which ties responsibilities to a team or a cluster of teams (i.e. team based), and yet are relatively simple to be understood by everyone – from the CEO to the front-liners, in this case, the instructors (i.e. strategic).
Both KPIs are based on data generated by graduates of IBTE. Generally, educational institutions rely on their alumni for a continuous stream of information to examine and improve the outcomes of their programmes (Loadman, Freeman, Brookhart, Rahman, & McCague 1999; Sageev & Romanowski 2001; Richardson, Slater, & Wilson 2007). Under Brunei’s TVET transformation, therefore, IBTE had commissioned a project to develop the two KPI surveys framework and investigate the feasibility of such surveys to be conducted annually thereafter. This paper describes the conceptual foundation of the two surveys, present selected findings from the two pilot studies and discusses their implications.
2 Graduates Employment Survey (ES)
2.1 Conceptual Framework
The Graduates Employment Survey (ES) is an annual survey conducted by the Research and Development Division (R & D), IBTE to survey the employment outcomes of graduates six months after their convocation ceremony. This survey claims much of its lineage from the “tracer studies” by then R & D, DTE which was carried out annually from 2009 till 2013 with the exception of 2012.
Improvement from past practices
The previous tracer studies had surveyed graduates several months after completing their course, to find out students’ opinions on the programmes learnt, the quality of teaching-learning, the relevance of their industrial attachment and their employment status after graduation (DTE 2010).
Previously, the time period whereby the tracer study was conducted varied between two (2) months to eight (8) months after graduation (Amalina & Chin 2012). The timing of the survey for these tracer studies, therefore, was thought not to be consistent and optimal, especially for comparison with future ES. For instance, following this TVET transformation, some programmes will have more than one intake of students per academic year, thus resulting in different completion phases. This would have complicated the time period to be allocated for data collection, as different groups would have different time length being out in the job market. Therefore, we resolved to finalize and standardize the conceptual framework of ES, whereby the status of graduates will only be assessed six months after their convocation ceremony. Other than the basis that one may only effectively look for a job after obtaining their official qualification certificate, status of graduates six months after convocation or graduation seems to be the yardstick when compared to the employment surveys carried out in other educational institutions worldwide e.g. Canada (Cambria College 2014) and Hong Kong (HKUST 2014).
More often than not, the length of time to complete these tracer studies, as well as the type of report produced, also varied and depended mostly on the R & D personnel who were put in charge. The ES aims to minimize this variability by documenting its standard operating procedure to enable comparability with future ES, despite changes in the R & D personnel. While the ES owes much of its framework to the previous tracer studies reports published by then R & D, DTE, this new working framework is simpler (e.g. shorter number of questions), yet comprehensive (e.g. all graduates to be contacted). The survey should be able to be completed within two (2) months – one month of data collection and one month of analysis and report write-up. This shorter timeframe enables up-to-date information to be shared in a timely manner with the relevant stakeholders.
2.2 Development of current framework
The development of current ES framework started in late 2013, in line with other initial preparations made for Brunei’s TVET transformation. The sampling approach as used in the tracer studies was re-assessed and its survey instrument revamped and further tested. To better understand the methodology developed in this project, readers will need additional information with regards to the previous tracer study.
The previous tracer study can be divided into two different parts; (i) graduates’ experience, obtained using a questionnaire distributed to graduates a few months after completing their course, and (ii) graduates’ employment status, as compiled by Group Coordinators (GC) for each courses offered. GCs are akin to class/group tutor who are in charge of the students’ well-being and monitoring of academic progress. Most, if not all, GCs are also teaching staff, commonly being instructors to one or more units taken by the students. It can be assumed therefor that these GCs would know their group of students at personal level.
Accordingly, GCs would then be required to contact the graduates for the tracer study. However, it was noted that not all GCs might be fully committed to compile data on graduates’ employment status. This can be seen on the relatively low response rate for tracer studies, which ranged from 40.5% to 78.7%. Each VTI would also have a Research Coordinator (RC) whose task was to compile survey data at VTI level before submitting it to R & D for analysis. Previously, it would have taken even up to six (6) months for a tracer study report to be produced from start of the data collection phase, perhaps due to the lack of urgency and the low importance being placed on these studies in decision-making and planning of DTE and the seven (7) VTIs.
Enhancement of study instrument
Initially, there were only three items surveyed on graduates’ employment status for the tracer study; (i) graduate’s employment status (i.e. whether employed, unemployed or doing further study), (ii) employed graduates’ destination sector (i.e. whether working in government or private sector, or being self-employed), and (iii) relevance of job to courses taken for employed graduates. The questionnaire on graduates’ experience, on the other hand, is a bit more comprehensive whereby 20 items were included in the survey. This includes questions on graduates’ evaluation of the programme, perception on quality of teaching and learning, and perception on industrial attachment.
The tracer study instrument tried to capture too much information on the graduates’ experience as a student at the seven (7) VTIs, but not a lot on the graduates’ employment status. Yet, only limited analyses have been done to these data. As a result, most of the information in the data collected from the previous tracer studies remains to be fully extracted and systematically collated.
Three (3) separate instruments were thus developed for the ES – each to be filled by different groups. First is the ES form, a short form to be filled in by graduates on their employment status. These forms are then returned to GCs who will then fill in the GC form, a Microsoft Excel form. Usually GCs would be given one month to distribute and collect the ES form. Lastly, the RC form, needed to be filled in by RCs who would then compile the GES forms from GCs for each VTI before submission to R & D.
In the ES form, in addition to the three (3) items from the tracer study, graduates were also asked the following:
If status is unemployed, the reason for being unemployed will be asked. The rationale of this is to enable us to differentiate those who are unemployed by choice.
If status is undergoing further study, the place of study will provide more information on our graduates’ progression destination.
If status is employed, the new ES instrument will also ask for the employers’ affiliation, job title or post, graduates’ salary per month, and the duration to find job.
Questions on graduates’ student experience were no longer included in the survey as these aspects are being covered in a separate survey (Student Evaluation Survey) conducted at the end of their course. By doing so, the ES can be more focused in delivering its aims and objectives.
Improvements in study approach
Other than the survey instrument, issues in the data analysis approach and report layout and format were also addressed. For example, common highlights from the previous tracer studies was the employment rate, where the number of students employed was expressed as a percentage of the total number of graduates. The convention, however, considered only those who were actively entering the job market when calculating the employment rate (MOE 2014; NCVER 2014).
The previous tracer studies also relied heavily on the RCs to manually produce a summary table on status of graduates by programme for each VTI, based on the hardcopies of the survey instruments filled in by GCs. This step is time-consuming and would have benefited greatly from simple spreadsheet automation. The pilot ES saw an opportunity to produce a better workflow for RCs whose task now is to cross-check the summarized data as keyed-in by the GCs, thus improving data accuracy.
2.3 Procedures
2.3.1 Pilot Study
To ensure the validity of the instrument and that the questions are easy to follow, a pilot study was conducted on a group of 10 students whom are not part of the sample of this survey. Feedback included the need for the addition of Malay language translation to the instrument, and rephrasing of instructions, to give clearer instructions to the respondents.
2.3.2 Sampling approach and data collection strategy
The sampling frame for the ES would include all graduates from the seven (7) national VTIs (now combined under IBTE), by convocation cohort. Depending on the frequency of the survey being conducted, some other graduates’ employment surveys would consider a bigger sampling frame by combining several different convocation cohorts (Cambrian College 2014; Nel & Barnard 2010). Since our ES is an annual survey, the sampling frame is deemed appropriate and has been employed by other institutions for a similar survey such as Singapore’s GES (MOE 2014) and Australia’s ES (NCVER 2014).
Prior to the data collection phase, R & D would call up a meeting with the seven (7) RCs to brief them on the list of programmes and groups of students to be surveyed. The RCs would then notify the GCs involved. The graduates are contacted by their respective GCs to provide the information required, either by filling in the ES form directly, over a phone, or face-to-face interview with the GC. The whole process flowchart is given below (Figure 1):
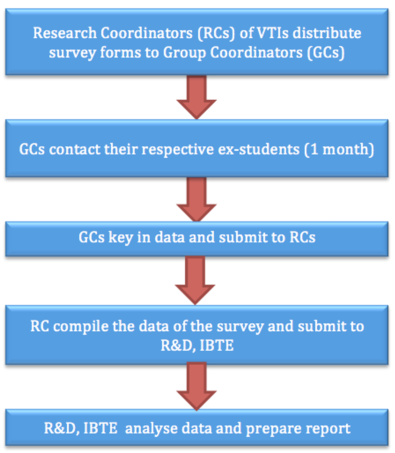 Figure 1: Framework of the administration of the Employment Study
2.3.3 Response rate
At the time of writing, IBTE is conducting the third round of ES since its commencement, which focuses on graduates from the 21st National Convocation cohort. The first ES, based on 854 graduates of the 19th National Convocation, saw a very high response rate of 97.7%. However, our most recent completed ES, which reported on 1013 graduates of the 20th National Convocation cohort, had a response rate of 90.9%. In both ES, the response rates varied across different programmes. The discrepancies between the first and the second ES response rates may have been affected by a change in the appointment of RCs.
Considering the relatively small number of graduates to be surveyed each year (< ~2000 graduates in total), we therefore suggested for each VTI to ensure response rates of at least 90% for future ES. This is to ensure that results disaggregated by programme are equally reliable.
2.4 Data analysis and key findings
Data compiled by RCs from each VTI were assembled into one national database, to be stored and maintained by R & D. Descriptive analyses of data were done in Microsoft Excel. Results obtained can then be disaggregated by institution, programme, field of study and/or qualification level. Key findings of the last two (2) ES is given below (see Table 1).
Table 1: Key findings for 2013 and 2014 Employment Study.
| Convocation date (cohort) | Total number of graduates recorded | No. of graduates contacted six months after convo (n) | Proportion of graduates | Employability rate | Job relevant to program (%) | ||
| Employed | Further study | Unemployed | |||||
| Nov 2013 (19th) | 854 | 834 | 44% | 36% | 19% | 67.3% | 64% |
|
May 2014 (20th) |
1013 | 921 | 42% | 38% | 20% | 71.2% | 71% |
It should be noted that in calculating the employability rate, the number of graduates who were unemployed by choice (e.g. chose not to work, or waiting to further study) is not included. Prior to the Brunei TVET transformation process, the SMT together with senior officials from the Ministry of Education had set targets for both KPIs, by benchmarking against common practices in the region (SPU, pers. comm.). Accordingly, IBTE aims for:
- An employability rate of 80% by 2017, and
- An employers’ satisfaction rate of 70% by 2017.
Overall employability rate for the first ES was 67.3%, with more than half of the programmes (25 out of 31 programmes offered) having an employability rate of more than 50%. However, only five programmes reached the targeted KPI (i.e. employability rate >80%). The second ES witnessed a slight improvement in the overall employability rate for IBTE graduates, which was 71.2%. Subsequently, ten programmes managed to reach the targeted KPI for 2014.
Two (2) types of outputs are produced from ES, (i) full report, and (ii) brief report. The full report would document a comprehensive summary of our graduates’ status six (6) months after convocation, to be shared amongst the SMT and relevant stakeholders (e.g. curriculum division) for planning and decision-making. The brief report, on the other hand, is a less technical and more graphical summary of the survey with general key points, usually to be shared with the public (e.g. industry, parents, students, secondary school counselors, etc.).
2.5 Challenges and improvement over time
Several challenges and limitations identified from the first ES include difficulties faced by GCs in getting in touch with their previous groups of students, and the difficulties for some GCs and RCs to fill in the simplified electronic forms (i.e. GC and RC forms). Also noted were the difficulties in tracking the graduates especially when the GC for a particular group is no longer available in the system – usually due to retirement, on study leave, or has been transferred elsewhere.
Also perhaps the main reason that lead to poor cooperation from the GCs in the first ES was the lack of a sense of importance of the survey. While the KPI itself is not a new concept and can be easily understood, prior to the survey there was no official statement relayed to the teaching staff regarding the integration of the KPIs as IBTE’s performance measures. Following this, efforts introduced to strengthen the system include issuance of official statement on the KPI, as well as sharing sessions with the teaching staffs regarding the survey.
Accordingly, the ES relies on GCs to contact graduates whom by then would have left the VTI system. Hence, one way forward is for the GC to develop ongoing contact with students, to ensure a high response rate.
3 Employers’ Satisfaction Survey (ESS)
3.1 Conceptual framework
The Employers’ Satisfaction Survey (ESS) is another survey conducted by R & D, IBTE which measures the employers’ (i.e. supervisors) level of satisfaction with our employed graduates. Generally, the survey aimed to obtain employers’ or supervisors’ perception of our graduates, not to evaluate the graduate. Therefore, it was agreed that the ESS will be an annual survey based on follow-up with the employed group of graduates identified from the ES (i.e. convocation-specific group). This is to enable results from the ESS to be used as one of the institution’s KPI.
Indeed graduate employment is one of the main objectives of TVET. As such, employers become an important stakeholder in TVET – employer perceptions of graduates to enter the workplace forms an essential part of quality assurance. No such study has ever been done either by IBTE or any other higher educational institution in the country. The goals of this pilot ESS project, therefore, were (i) to increase knowledge of and responsiveness to the TVET needs of the employers of our graduates, (ii) to evaluate the performance of our VTIs in producing graduates with appropriate skills and knowledge, and (iii) to build a working framework for future ESS surveys.
3.2 Study approach
In developing the instrument to be used in the pilot ESS, the project was informed by a comprehensive literature review of similar documents and their execution in other educational institutions or agencies (Oliver, Freeman, Young, Yu, & Verma 2014; Lujan 2001; Colleges Ontario (n.d.); Hakobyan 2010; Saskatchewan Apprenticeship & Trade Certification Commission [SATCC] 2013). These are displayed in Table 2. Few studies reported that it can be extremely difficult to contact employers for a survey on graduates’ satisfaction without being able to refer to a specific graduate (Oliver et al. 2014). Thus, most ESS tend to contact its graduates first to identify the supervisors to be surveyed, although the alternative (i.e. directly approach supervisors without having to contact graduates) had also been employed in some surveys.
Table 2: Comparisons of Employers’ Satisfaction Study (ESS) from several educational institutions worldwide.
| Item |
Australia’s Pilot ESS |
University of Texan Pan American ESS | One of Ontario’s college ESS | American University of Armenia ESS |
SATCC (Canada) ESS |
THIS STUDY | |
| A | Graduate population size | 8291 | 107 | 207 | 325 | ||
| B | No. of graduates responded | 2749 | 69 | 149 | |||
| C | No. of supervisors referral/contacted | 677 | 1405 | 57 | 143 | 2507 | 185 |
| D | No. of supervisors responded | 539 | 384 | 18 | 117 | 351 | 97 |
| E | Graduate representation rate (D/A) | 6.5% | – | 16.8% | 56.5% | – | 29.8% |
| F | Supervisor response rate (D/C) | 79.6% | 27.3% | 31.6% | 81.8% | 14.0% | 52.4% |
| G | Length of data collection phase | 3 months | 5 months | Not stated | 1.5 months | 1 month | 3 months |
The pilot ESS focused on direct supervisors of graduates of the 19th National Convocation (who were involved in the first ES described in previous section). These direct supervisors are not necessarily the managers or head of departments of the company/organization, but rather those who are familiar with the day-to-day work and performance of the graduates.
3.2.1 Development of study instrument
The survey instrument was designed to be simple and short, to make it easy for the respondents to fill in the survey in less than ten (10) minutes. The instrument draft draws on commonalities with other ESS, but mostly guided by the five clusters of ESS framework as identified by the Australian ESS report (Oliver et al. 2014), namely foundation skills, adaptive skills, teamwork and interpersonal skills, technical skills and domain-specific knowledge and employability skills. Our survey instrument, therefore, consisted of 14 items related to indicators of perceived satisfaction on the work and performance of our hired graduate as well as employers’ views on TVET in Brunei in general. The questions were relatively highly reliable (internal consistency reliability, Cronbach’s alpha = 0.917), and the instrument underwent the process of triangulation with a group of IBTE staff who were supervisors to attachment students to further ensure reliability and validity of the survey questionnaire.
3.3 Procedures
3.3.1 Pilot study
A pilot study was conducted on five (5) supervisors from a selected oil and gas company. Changes were made accordingly based on their feedback to ensure that the questions are easy to follow.
3.3.2 Sampling approach and data collection strategy
Prior to surveying, a list of employers’ contact details was compiled by calling the graduates individually. During the survey, where graduates could not be contacted, direct contact was made with the company, either through email, phone or by meeting the supervisors face-to-face.
To ensure the survey was representative, a minimum effective sample size was calculated. Initially, supervisors to 152 graduates were required for the “employed graduates” population to be representative. However, it later became apparent that some of the graduates were no longer employed for a variety of reason (for instance, to continue with further study, personal choice to not work, etc.). As a result, the total number of employed graduates with employers’ details was reduced to 325 graduates (i.e. population size). Allowing for non-compliance, a total of 97 respondents were obtained. Therefore, with a graduate representative rate of 30%, the sample size was representative at 90% confidence interval with an accepted error of 6.9%.
Surveying was conducted over five (5) weeks, from 16th April 2014 till 24th May 2014. This was around six (6) months after the ES (or about a year after their convocation ceremony). It was agreed that only employed graduates as identified from the ES would be contacted (i.e. not all graduates re-contacted), to ensure that graduates have been working for at least 6 months with the company/organization. This is to address the issue with some companies that have their own policy whereby supervisors can only evaluate employees after six (6) months of being hired by the company.
3.3.3 Response rate
Our pilot ESS had a supervisors’ response rate of 52.4%. The majority of respondents were employees of companies related to the oil and gas industry (29.9%), followed by those providing professional and technical services (16.5%) and companies in the construction or construction-related industry (10.3%) (Figure 2).
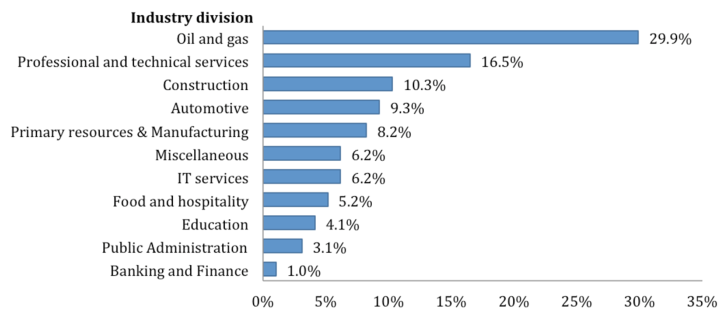 Figure 2: Distribution of respondents by field of industry of their employment (n=97)
Some supervisors were emailed at least three (3) times, first being the initial introduction email, a second follow-up email and a final reminder email. Where additional contact details were available, some of the follow-up was also made via phone, before being directly approached. Yet, still a number did not respond to the survey.
3.4 Data analysis and presentation of key findings
Data was keyed-in automatically via the built-in function when creating online questionnaire using Google Form. For data analysis, the dataset was transferred into Microsoft Excel to enable descriptive analyses to be carried out.
Accordingly, almost all of the employers (except 3 which declined to answer) are either satisfied (64.9%) or very satisfied (35.1%) with the overall work and performance of hired graduates, resulting in an overall employers’ satisfaction rate of 96.5%. Figure 3 also shows their level of satisfaction based on the field of industry of employment.
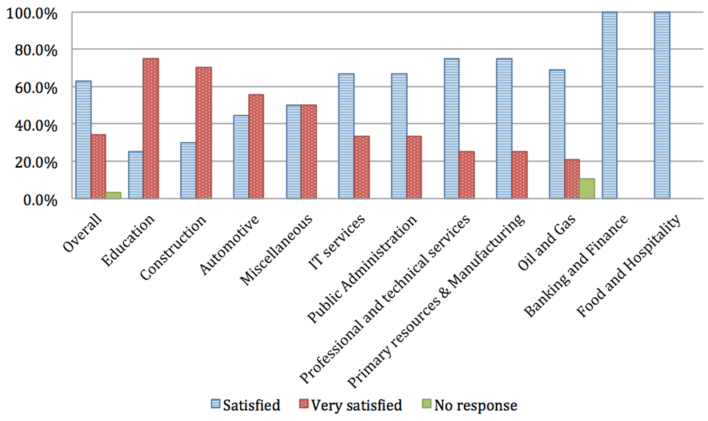 Figure 3: Employers’ level of satisfaction on overall work and performance of graduates by industry division (n=97)
Similar to ES, results of the analysis from ESS were presented either in a full report or a brief report. The data collected also enabled results to be aggregated by field (industry sectors), and graduates’ previous programmes and previous VTIs, which is useful feedback for SMT to make informed decisions and assist planning. Additionally, this survey also provided an opportunity for employers’ feedback, comments and suggestions on TVET in Brunei, thus improving collaboration between IBTE and the industries.
4 Conclusion: Lessons Learned and the Way Forward
TVET in many countries, and some for quite a long time, is at a crossroad between a rapidly expanding education system and a fast-changing labour market. Redirecting planning from an institution-focused to a more client-focused approach is a priority objective of IBTE, embedded in its official mission, which is “to produce highly skilled and employable graduates that meet stakeholders’ expectation through holistic learning environment”. In pursuing international best practice, IBTE has developed and assigned two KPIs that are aligned with the institution’s strategy that work together to promote more effective decision-making in order to respond to the labour market needs. Results from the two pilot surveys have highlighted issues and potential limitations, shown direction to improvements, and set baseline values for future use. There is a need for TVET providers to invest in a systematic outcome based measures to ensure that the system is aligned to the labour market.
References
Amalina, H. & Chin, W. K. (2012). A longitudinal study on the employability of Business school graduates of vocational and technical education in Brunei Darussalam. Paper presented at the Brunei Darussalam Teacher’s Day International Conference 2012, “Crafting Innovative Instruction: A 21st Century Perspective”, ICC, Brunei Darussalam, October 10-11, 2012.
Cambrian College (2014). Graduate employment report 2013 – 2014. Online: http://docplayer.net/7664255-Cambrian-college-2013-2014-graduate-employment-report-cambriancollege-ca-sudbury-ontario.html (retrieved 09.01.2017).
Colleges Ontario (n.d.). Key performance indicators. Online: http://www.collegesontario.org/outcomes/key-performance-indicators.html (retrieved 09.01.2017).
DTE (2010). Tracer study report. Brunei Darussalam: R & D.
Hakobyan, N. (2010). American University of Armenia: Employer satisfaction survey of AUA graduates. Online: http://iro.aua.am/files/2012/03/2010-Employer-Satisfaction-Survey.pdf (retrieved 09.01.2017).
HKUST (2014). Hong Kong University of Science and Technology – Graduate employment survey. Online: https://career.ust.hk/web/page.php?sid=25 (retrieved 09.01.2017).
Loadman, W. E., Freeman, D. J., Brookhart, S. M., Rahman, M. A., & McCague, G. J. (1999). Development of a national survey of teacher education program graduates. In: The Journal of Educational Research, 93, 2, 76-89.
Lujan, S. S. (2001). The University of Texas Pan American – Employer Satisfaction Survey.
Ministry of Education, Brunei Darussalam (2012). The Ministry of Education Strategic Plan 2012-2017. Brunei Darussalam: Strategic Management Unit. Online: http://planipolis.iiep.unesco.org/upload/Brunei%20Darussalam/Brunei_Darussalam_Strategic_Plan_Book_2012-2017.pdf (retrieved 09.01.2017).
Ministry of Education (Singapore) (2014). Graduate employment survey. Singapore: Author. Online: https://www.moe.gov.sg/docs/default-source/document/education/post-secondary/files/nus.pdf (retrieved 09.01.2017).
Nel, H. & Barnard, A. (2010). Graduate Employability: A case study of Nelson Mandela Metropolitan University. Online: http://www.saqa.org.za/docs/pres/2010/nel_h.pdf (retrieved 09.01.2017).
NCVER (2014). Australian vocational education and training statistics – Student Outcomes 2014. Online: https://cica.org.au/wp-content/uploads/Student-Outcomes-NCVER.pdf (retrieved 09.01.2017).
Oliver, D., Freeman, B., Young, C., Yu, S., & Verma, G. (2014). Employer satisfaction survey: Report for the department of education, June 2014. Online: https://docs.education.gov.au/system/files/doc/other/ess_final_report_june_14_0.pdf (retrieved 09.01.2017).
Parmenter, D. (2012). Key performance indicators for government and non profit agencies: Implementing winning KPIs. Hoboken, NJ: John Wiley and Sons, Inc.
Peng, F. & Zhang, J. (1997). On the education of information resource management professionals at high level in China. In Ward, P. L. & Weingand, D. E. (eds): Human development: competencies for the twenty-first century. Munchen.
Richardson, J. T., Slater, J. B., & Wilson, J. (2007). The national student survey: Development, findings and implications. In: Studies in Higher Education, 32, 5, 557-580.
Sageev, P. & Romanowski, C. J. (2001). A message from recent engineering graduates in the workplace: Results of a survey on technical communication skills. In: Journal of Engineering Education, 90, 4, 685-693.
SATCC (2013). Apprentice and employer satisfaction survey report. Online: https://dl.dropboxusercontent.com/content_link/CcA4ZZVLZhnDss9iX6wVG0ztiUSGpdKG2hd4NiBxiiayqV9ScbszZcZQDK9tB28r/file (retrieved 09.01.2017).
Citation
Ebil, S., Othman, N., Hjh Norhakimah, H.M.N., Marlinawati, H.A., Omarali, M, & Chin, W. K. (2017). Brunei TVET Transformation: The Development of the Institute of Brunei Technical Education’s two Key Surveys. In: TVET@Asia, issue 8, 1-15. Online: https://www.tvet-online.asia/issue8/ebil_etal_tvet8.pdf (retrieved 28.01.2017).